Using Flipboard to Build Digital Library

Like you, I am constantly bombarded by information. It comes at me from every direction and most of it I let just flow on by. However, there are somethings that I would like to keep and even share with my colleagues and family. While I use OneNote and Evernote for storing some of this information, sharing it with others has to be more purposeful. This is where Flipboard comes in. When you set up a free Flipboard account on your phone and computer you are asked to indicate which “magazines” you want to have stories feed into your account, again, all free. I can sort by specific outlets or by generic themes, like Educational Technology and get articles that fall into that category flow into my feed.  Even better, I can set up my own magazine(s) and “clip” any articles to go into that magazine. Everyone on FlipBoard can then subscribe to MY magazine(s) or we could set up a collaborative magazine.

This is a cool tool that you can use the rest of your life.  If you would like to know more, check out the link below:

Learn the Basics About How to Use Flipboard


Excel – Pivot Table 2

Using pivot tables in Excel is relatively easy and can give you a much better look at your data. In this tutorial I demonstrate how to clean a spreadsheet, how to add a column of data using an if/then formula and then how to build the pivot table showing three different views of the same column of information, each providing a different perspective on the information.  This is all arranged in an easy to read format which can be printed and shared with colleagues.

Hope you enjoy.  Please leave a “like” or a comment.

Images for Presentations

Inserting images into your presentations for class can definitely take your presentation up a notch. In fact, there are many who say that using images instead of words has a better effect on retention and communication. I suppose part of that is because if you are showing words on the screen and also trying to talk the audience is trying to read the words and listen at the same time, which lessens the impact of both.

I do use some bullets in my presentations with a minimum number of words – always keeping the font at 28pts or larger, or even a quote from time to time. For the past few years, I have attempted to use images instead of text.  But, the big question then becomes where do you find copyright and royalty free images that are unique AND communicate the text they are replacing.

I have two sources for you. The first is described in the article at this LINK. It is a new site with access to over 300 million images.  The second is Pixabay.  I’ve not had a chance to try the Creative Commons site yet, but I do love the images from Pixabay. Check these sites out if you want to add some punch to your next presentation.

Excel Tip – Pivot Table 1

Pivot tables are among the most powerful features in Excel. For years I shied away from them because I thought they must be too difficult for me to grasp and too complicated to build – WRONG! Pivot Tables are relatively easy to build and the information provided can literally save you hours and hours of work.  It is definitely a win-win situation. I hope you will watch this short video (about 6 minutes) and then think about how you can experiment with Pivot Tables yourself.

Excel Tip – Chart from Filter

I always love learning new tips in Excel that can help me communicate data in a way that contributes to better decision making. Just having a lot of data is relatively useless unless you can present in such a way that it makes sense.

In this tutorial, I have used the filter and sort procedures I shared in other tips as a foundation for charting my data.  Hope you enjoy.

Excel – Tip – Setting conditional Formatting

Sometimes, even with the ability to filter and sort in all the ways you have learned so far, it would be nice if there was some way to make some information “pop” visually so that you could better identify certain data-points which may affect a decision or outcome.  That is where conditional formatting comes in.  The use in this tutorial of conditional formatting is barely scratching the surface of what is available but I think you will see the potential and hopefully experiment with this truly powerful feature.

Excel – Tip – Separating Data within a Cell

Now that you know how to filter and sort – what do you do when there isn’t a column with just the data you need? If you have a column which contains that information but it is mixed in with other information, this video will show you one way to separate out that information. Once you have pulled out the specific information you need into a separate column, you can then filter and sort just as you learned in the first tutorial.

Excel – Tip – Filter and Sort

The ability to filter and sort large blocks of data within an Excel spreasheet makes it possible to identify the right information necessary to make data-driven decisions. Excel has a very easy process for turning the entire spreadsheet into a table that can be easily filtered and sorted.  This first tip is the beginning of the process.  I will be sharing others over the next few weeks which will expand on this initial idea.  Trust me, this is a BIG deal and will make you look like a star to your co-workers and boss.  Be sure to watch the follow-up tutorials which expand on this ability.

Zoom – Video Conference

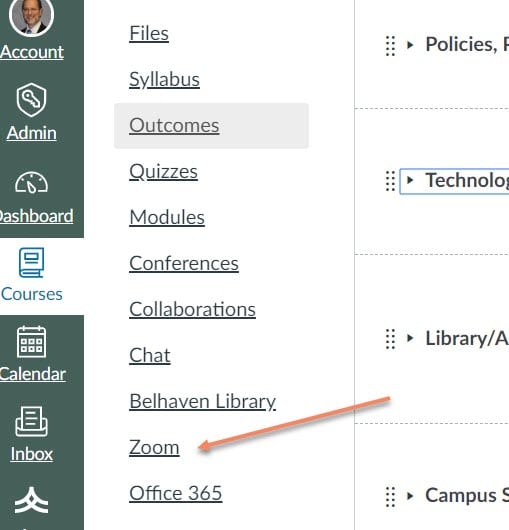
You probably are already aware that you have access to a powerful video conference tool from inside Canvas, titled Zoom.  I’ve included a picture of the link.  Zoom is very easy to use and intuitive, meaning that you should be able to use it with only a little trial and error. Below I’m going to discuss Why you might want to use Zoom, and How to set it up and use it.

WHY

I’m going to list several scenarios in which you might benefit from using Zoom:

  • As a way to have team project meetings. One of the barriers to team project meetings is the problem of coming out one more night, or getting to class early. Either option might be impossible. With Zoom, you can set up a team project meeting anytime during the week or weekend that works for your entire team.
  • To record a presentation or tutorial.  Zoom is perfect for recording a presentation or tutorial of some computer application.  Whatever you can see on your desktop can be shown through Zoom and recorded and made available to your classmates or the instructor.
  • To set up an optional (strictly voluntary) class meeting relative to a specific event, e.g. you could set up a Zoom to discuss political debates following the debates while everyone is still fresh.
  • These are only a few ideas, but I’m sure you are getting the idea.

HOW

Starting a Zoom is very easy, all you will need is your Belhaven login and password.  Once you click on the Zoom link you will want to “Host” a meeting after you enter your credentials.  To invite others email them the link.  I’ve included a video below which walks you through the process.

Let me know how it works for you.